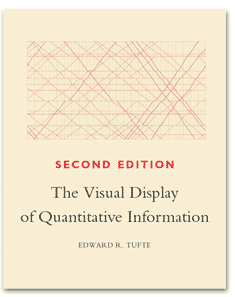
First published in 1983, this book’s author Edward R Tufte took out a second mortgage so that he could publish it himself and retain control over the book’s design so that it reflected the principles he was setting out.
This is a classic text on the design of statistical graphics, written well before the rise of digital infographics.
Tufte demonstrates why and how to convey statistical data in an effective but also elegant manner. Look out for his views on the pie chart.
The classic book on statistical graphics, charts, tables. Theory and practice in the design of data graphics, 250 illustrations of the best (and a few of the worst) statistical graphics, with detailed analysis of how to display data for precise, effective, quick analysis. Design of the high-resolution displays, small multiples. Editing and improving graphics. The data-ink ratio. Time-series, relational graphics, data maps, multivariate designs. Detection of graphical deception: design variation vs. data variation. Sources of deception. Aesthetics and data graphical displays.
The first edition was printed 17 times.
Author
Statistician, visualiser and artist Edward Tufte is Professor Emeritus of Political Science, Statistics, and Computer Science at Yale University.
Reviews
“This book is a gem.”
Ergonomics
More from EdwardTufte.com.
![[ad] CFRE - show them you know best-practice fundraising. Be a CFRE. Image of a woman's face, in the bottom right the CFRE logo.](https://fundraisingworld.dev10.dekodes.no/content/uploads/2023/10/Example_ad.png)